|
How do I use the UTM Performance Report?
The Campaigns Dashboard provides a quick “at a glance” look at your most important marketing metrics for all your online marketing activities as a whole, or for a single traffic source or ad campaign.
But the UTM Performance Report is where you can easily analyze your data just about any way you want, filter your stats by any combination of UTMs or date range, and sort your stats any way you want.
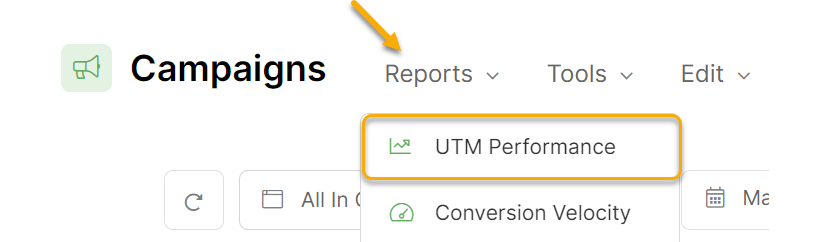
To get to the UTM Performance Report, click on the Reports menu and select “UTM Performance Report”.
If you have a lot of data it may take a few moments, but once your report is generated you can slice and dice your stats in just about any way you want almost instantly!
To get started, just select “Stats by” Source, Campaign, Term or Content depending on whether you want to analyze your stats by traffic source, ad campaign, keyword or individual ads.
You can of course set any date range you’re interested in, you can drill down even further by using the additional UTM filters, and you can sort your results by any metric you’re interested in by simply clicking on that column header.
The UTM Performance Report is perfect for answering questions like:
What are my top-performing ads, that I should try to scale further?
What are my worst-performing ads, that I may want to consider turning off?
What is the exact ROI for all my different keywords or ad placements?
What’s my Sales Conversion Rate for all of my different traffic sources?
How much does it cost me for a lead from each of my traffic sources?
What’s the lifetime value of a customer from each traffic source or ad campaign?
What is my Average Order Value for each of my ads or traffic sources?
… and just about every other important marketing question you need an answer to.
For example, to find your most profitable keywords you would simply select “Stats by” Term, and then sort by Profit, ROAS or ROI depending on exactly which metric you’re most interested in.
If you wanted to find your least profitable keywords, simply click the column header again to reverse the sort and now your least profitable keywords will be listed at the top of the list.
Note: Please note that the totals shown at the bottom of the UTM Performance Report may not always exactly match the totals shown on your main Dashboard.
For example, if someone clicks your Facebook ad and opts in, then a week later they click your Google ad and opt-in again using another email, the Performance Report is going to show an opt-in conversion for both traffic sources.
But on the main dashboard this user will only be counted once when it comes to calculating stats like your opt-in conversion rate, etc.
This is what you want, it’s just that the two screens are showing your data in different ways so we wanted to point this out.
Article 682 Last updated: 11/21/2023 5:56:28 AM
https://www.clickmagick.com/kb/?article=682