|
How do I use the Lifetime Value Report?
The Lifetime Value Report provides incredibly valuable data that helps your business scale to new heights.
The Lifetime Value Report uses "cohort analysis", which focuses on distinct groups of visitors to see what they do over time. In the report, your customers are grouped into cohorts based on when they placed their first order with you.
For each cohort you can see when customers placed their first order, what the average Customer Acquisition Cost (CAC) was, the Average First Sale (AFS), and the average cumulative sales over time.
Knowing the CAC and the culmulative sales shows you exactly how long it takes for you to break even!
Combined with UTM filters, this provides an incredibly powerful look at how each traffic source, campaign, adset, ad or overall site is performing long-term, rather than relying on initial Average Order Values (AOV) to make decisions.
The report instantly let’s you answer the questions:
- How much does it cost to acquire a new customer?
- How much do they spend over time?
- How long till I break even on my ad spend?
- How effective are my email or SMS marketing campaigns in driving repeat customers?
As you look down the report, you can see whether your numbers are getting better or worse, which allows you to scale up your marketing efforts, or set aside a losing ad campaign.
With this information, you can make optimization decisions such as how much to spend to acquire each customer, knowing you will be making more profit from those customers over the next few months.
It also helps you build initiatives to make more from each customer, whether it be from email, SMS, or retargeting campaigns because you can see how these things change the lifetime value of an average customer over time.
To access the Lifetime Value Report, go to your Campaigns Dashboard, click on Reports, then Lifetime Value.
You'll see a few columns and abbreviations, so to start with let’s go over what they mean. We’ll be using the screenshot below to give examples ...
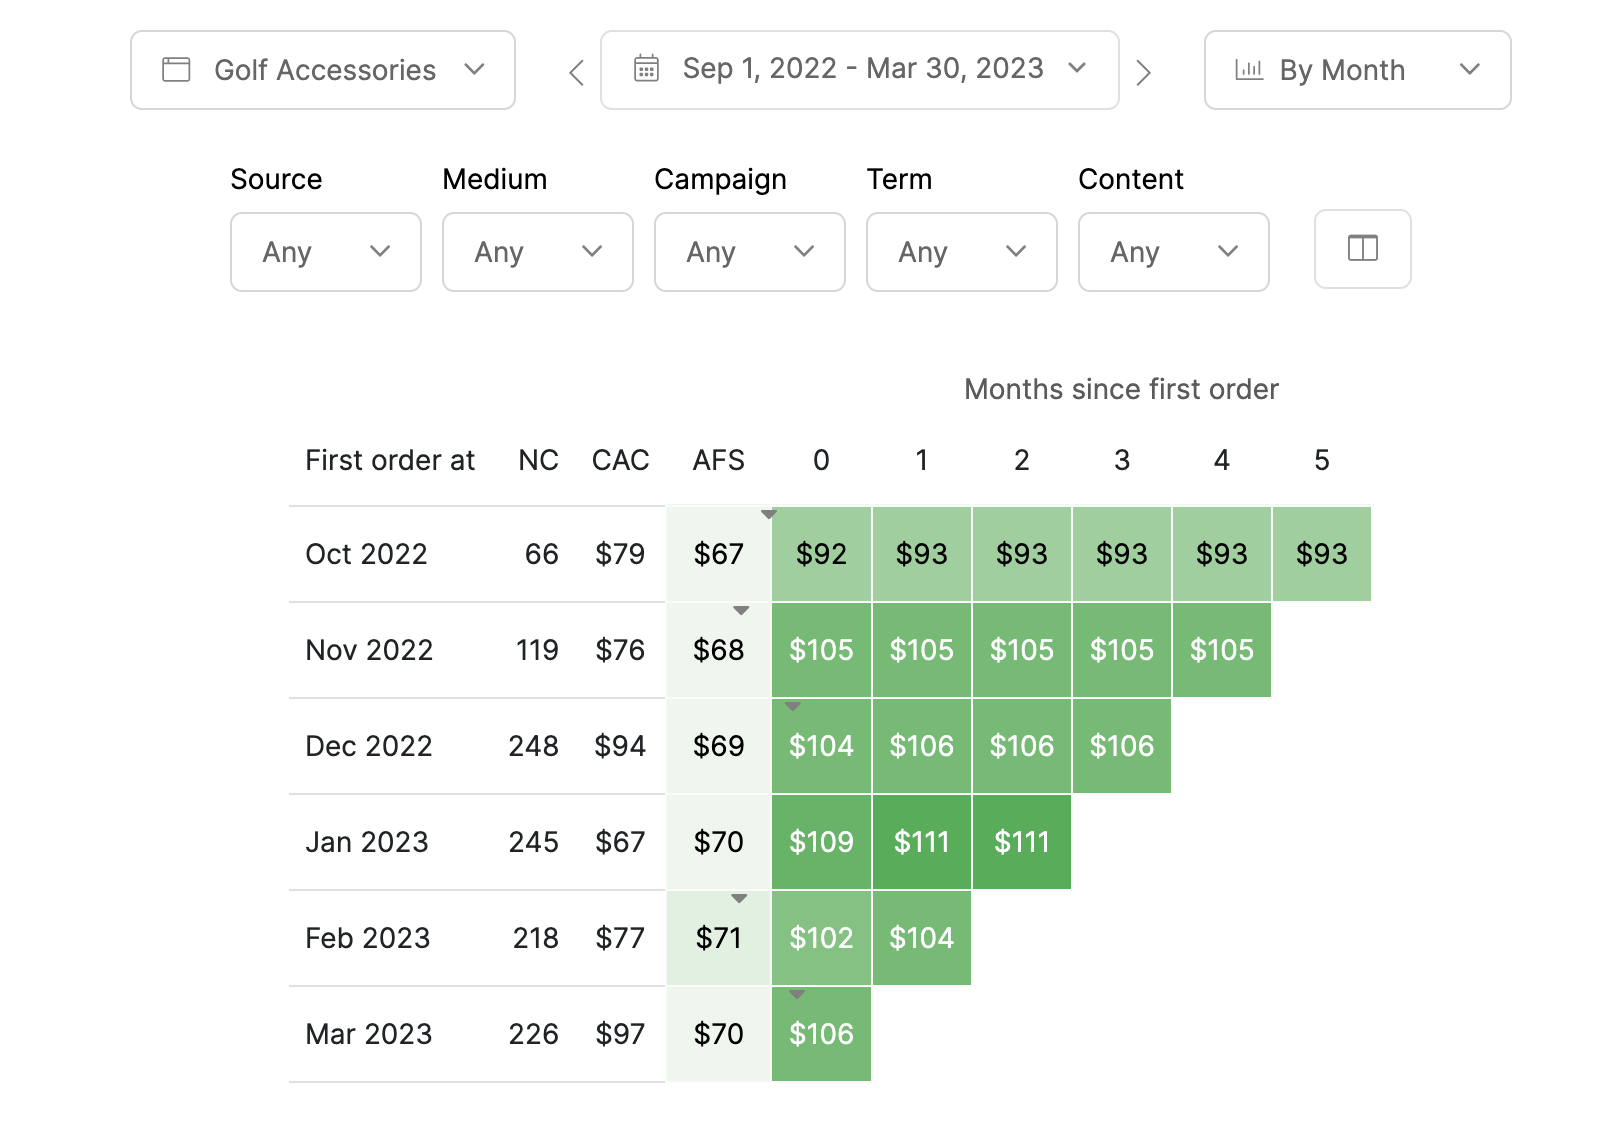
| First order at | The starting week, month or quarter that each cohort (group of customers) made their first purchase with you. |
|
| NC | New Customers. This represents the number of new customers you had during the time period. This does not include repeat sales from customers who bought from you before the current time period. |
|
| CAC | Customer Acquisition Cost. This is your average cost to acquire a new customer for this cohort. |
|
| AFS | Average First Sale. This is the average order amount of the very first sale from each new customer. (The AFS is not the average of the AOV for each new customer since the AOV includes all sales a new customer makes during their first 24 hours.) |
|
| 0, 1, 2, 3... | Each of these columns represents a time period and shows the average cumulative value of a customer over time. Column “0” shows the average value of a customer during the time period where they made their first order. Column “1” is the next time period, and so on. |
|
| Breakeven |
Look closely and you’ll see little gray arrows “” for each cohort, indicating when and where the average customer value equals your CAC. This shows you exactly how long it takes to break even for each traffic source, campaign or ad, so you can manage your ads accordingly. |
Article 860 Last updated: 05/06/2023 11:54:02 AM
https://www.clickmagick.com/kb/?article=860